Coordinates & Graphs
Coordinates and graphs help us locate points on a grid and visualise relationships between numbers. These skills are essential for geometry, algebra, and 11+ problem solving.
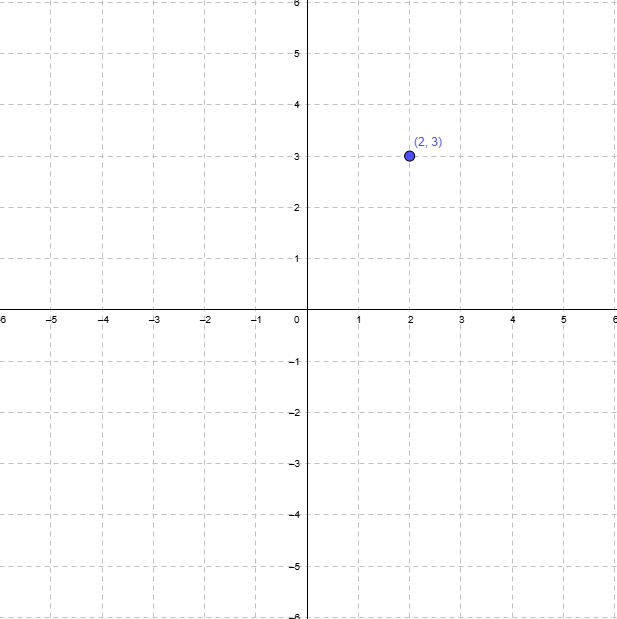
📍 Coordinates are pairs of numbers that tell us the position of a point on a grid. They are written as (x, y), where x is the horizontal position and y is the vertical position.
Example: The point (2, 3) is 2 units across (right) and 3 units up.
📊 Graphs help us show how numbers are related. Common types of graphs include:
- Line graphs – show how values change over time.
- Bar charts – compare quantities visually.
- Scatter plots – show patterns or relationships between two sets of numbers.
Remember: "Along the corridor, then up the stairs" is a great way to remember to read the x-axis before the y-axis!
Tips:
- Always label your axes clearly.
- Check that each unit is equal on the grid.
- Plot points carefully and connect them if needed for line graphs.
Understanding coordinates and graphs allows you to visualise problems, find missing points, and interpret data for 11+ maths.
Practice Papers
| Title | Level | Download |
|---|---|---|
| No practice papers available at the moment. Please check back later. | ||